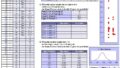
Exercise 1: The case of equal variances
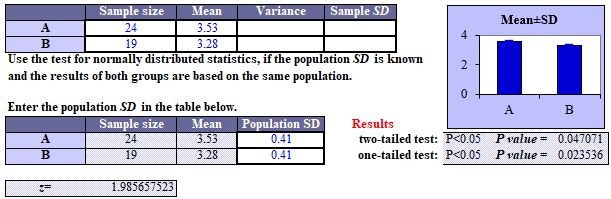
The standard deviation of newborn birth weight in a certain region is 0.41 kg. The mean birth weight of 24 newborn babies in the north area of the region was 3.53 kg and that of 19 newborn babies in south area was 3.28 kg. Analyze whether there is a statistical difference between the 2 areas.
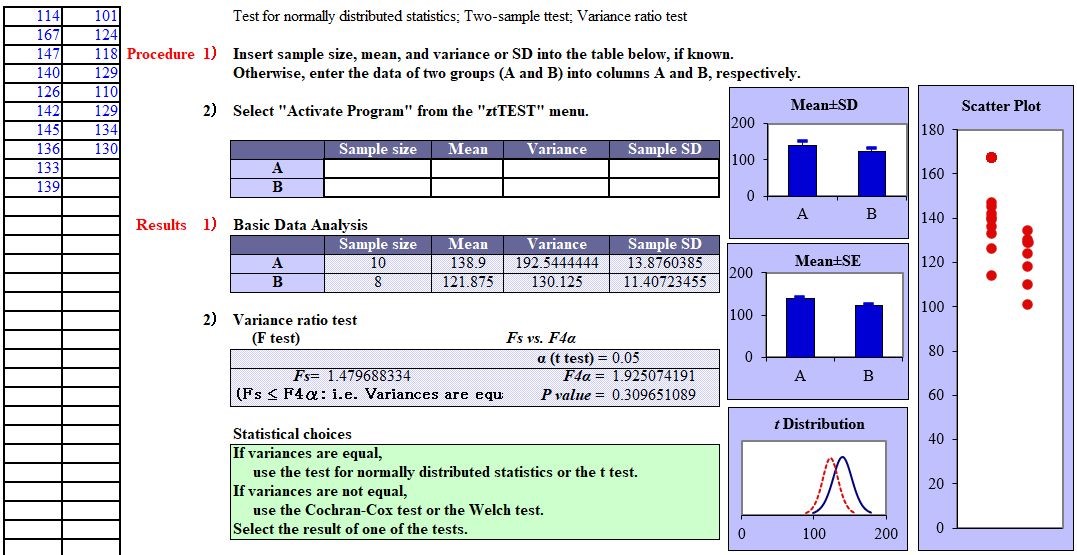
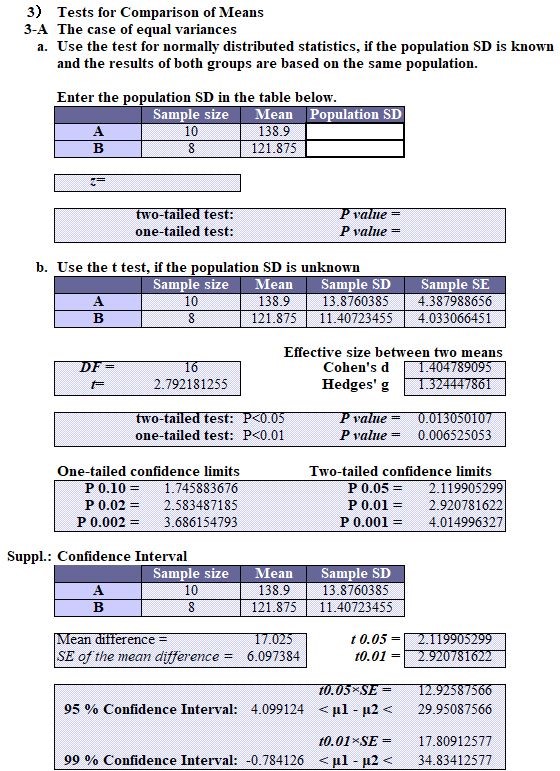
Exercise 2: The case of equal variances (t test)
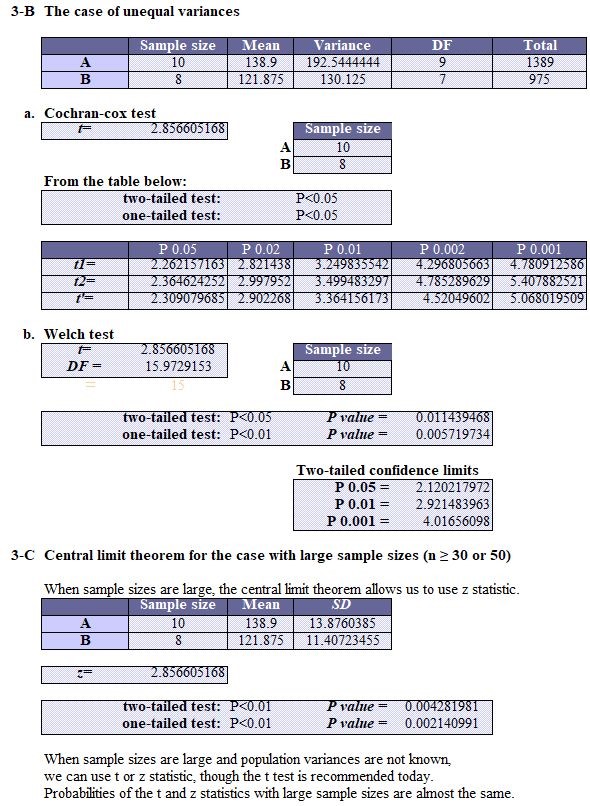
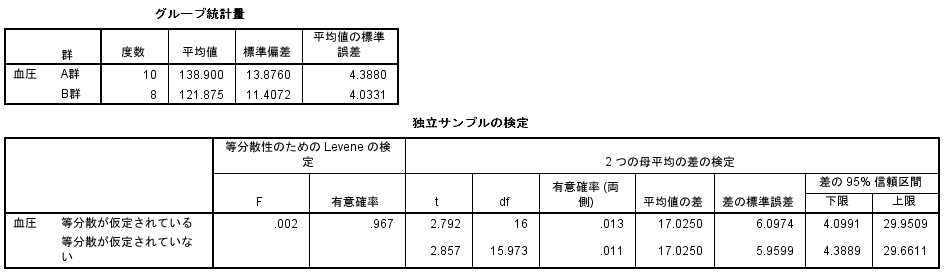
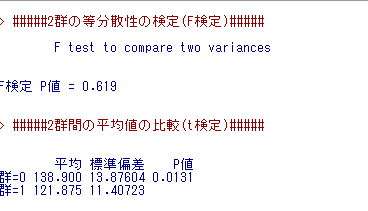
Patients with mild hypertension were randomly allocated into 2 study groups, and 2 different antihypertensive drugs were administered in each group. Examine whether peak blood pressure (mmHg) shows a difference between 2 groups after a certain period of treatment.
Comparative Verification Test
Variance ratio test (F test): StaFinale, 0.30965×2=0.619; SPSS, Not Done; EZR, 0.619.
Variance ratio test (Levene test): SPSS, 0.967.
T-TEST (equal variances): StatFinale, 0.0131; SPSS, 0.013; EZR, 0.0131.
Welch test (unequal variances): StatFinale, 0.0114; SPSS, 0.011; EZR, 0.0114.
Reports of SPSS & EZR
As a result of the variance ratio test, SPSS and EZR display a two-sided probability, while StatFinale displays a one-sided probability (“F-test value ÷ 2”). The F-test and Levene test values are a two-sided probability. If the one-sided probability is “< 0.05”, it means there is a “significant difference”.
The Excel formula FTEST displays a two-tailed probability of the F-test, and FDIST displays a one-tailed probability of the F-test.

※Click pics to enlarge.