Multiple Comparisons (Bonferroni & Tukey HSD) with Confidence Intervals
Exercise:
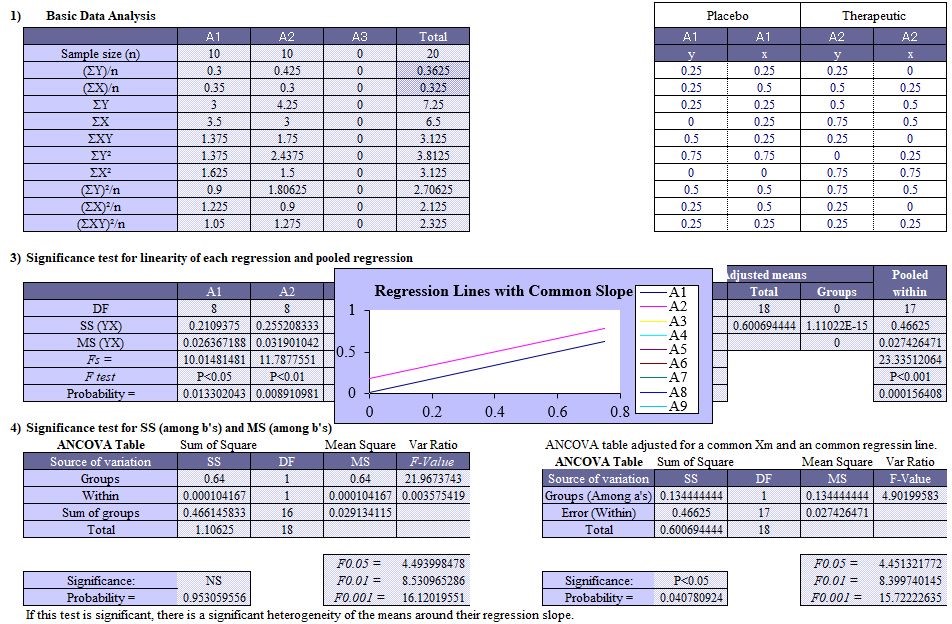
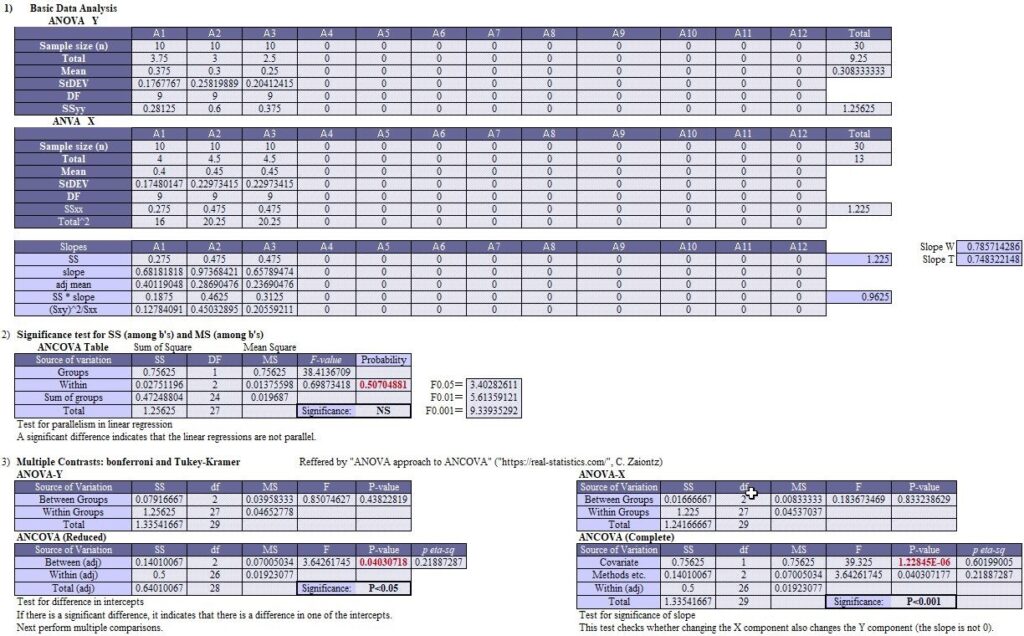
Twenty atopic dermatitis patients were randomly allocated into 2 groups (baseline), and a therapeutic drug or placebo drug was administered to treat itching sensation. The levels of the itching sensation at pre- and post-treatment were assessed by the 5-level itching evaluation score, which were 0, 0.25, 0.5, 0.75, and 1 from mild to severe itching sensation. The results are shown in the following table.
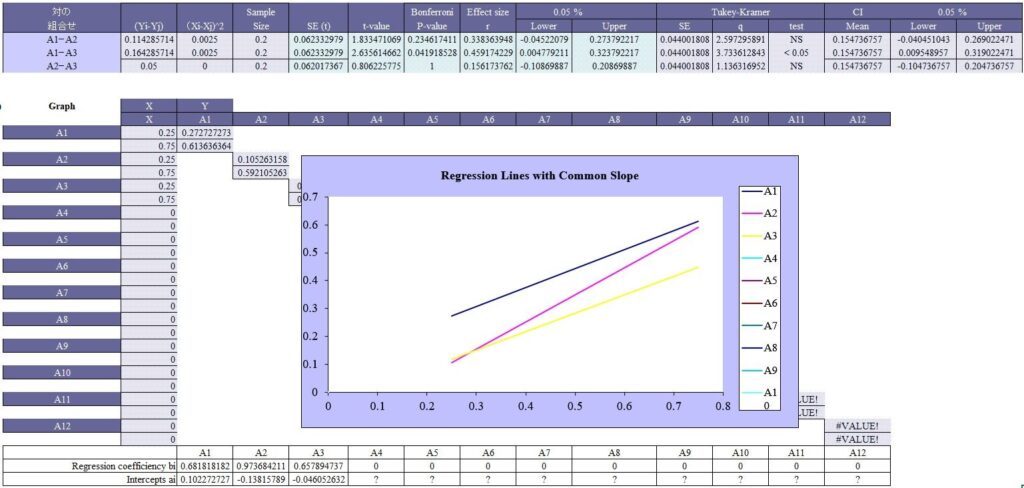
A1 is placebo drug and A2 is the therapeutic drug. X represents pre-treatment score, and Y represents post-treatment score, respectively. Draw a graph of 2 groups, where X- and Y-axes indicate pre-treatment and post-treatment scores, respectively, and also analyze the difference in Y values (post-treatment scores) between groups.
Comparative Verification Test
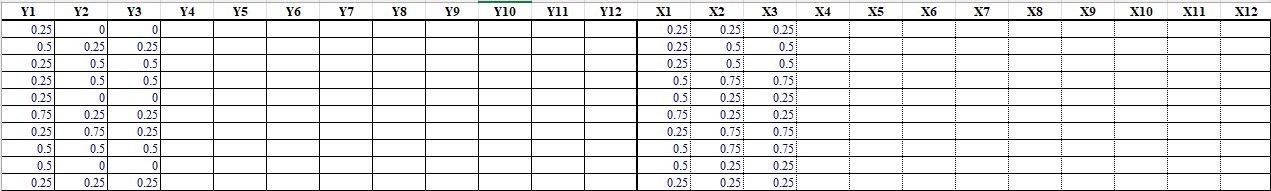
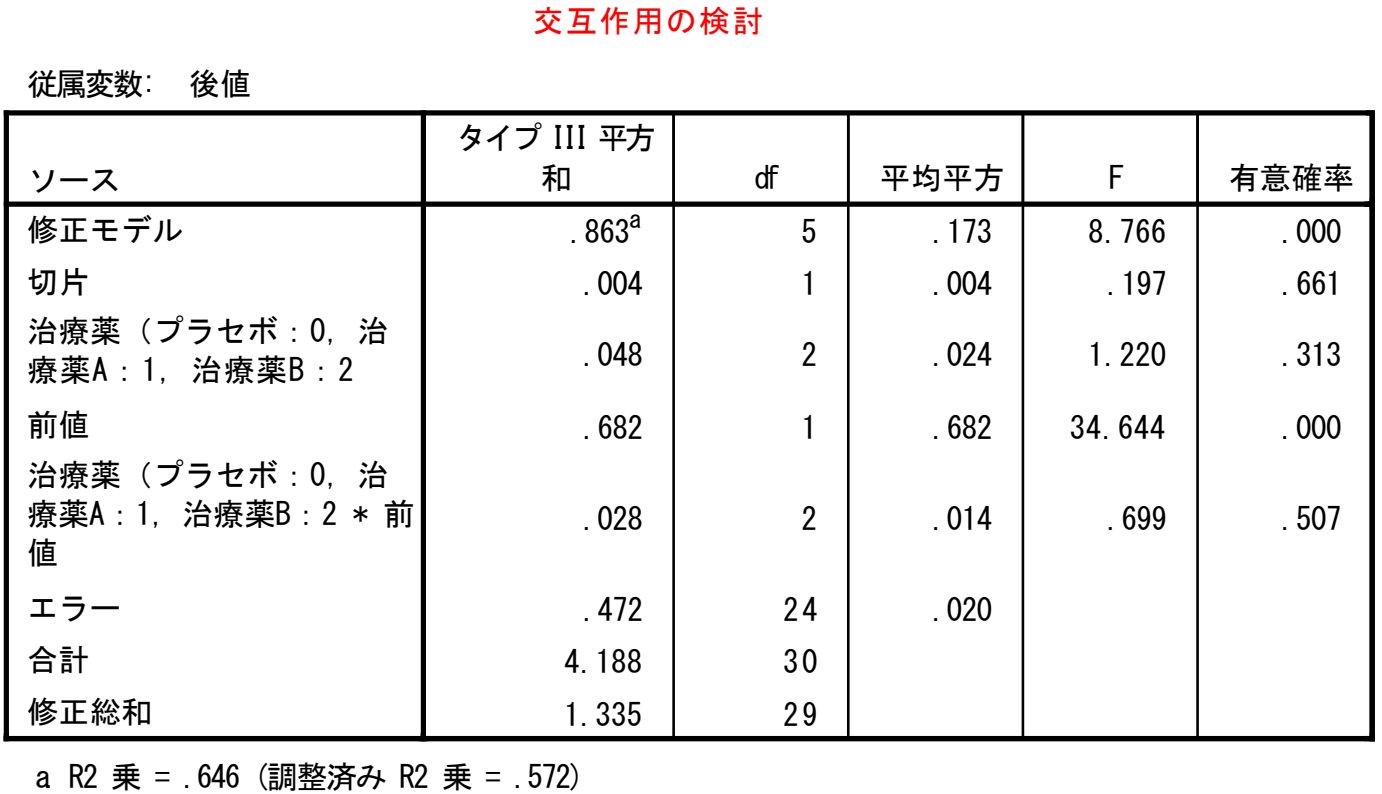
Significance test for SS (among b’s) and MS (among b’s): StatFinale, 0.507; SPSS, 0.507; EZR, 0.507.
P-value (Covariate):StatMate, 1.228E-06; SPSS, 0.000; EZR, 1.228E-06.
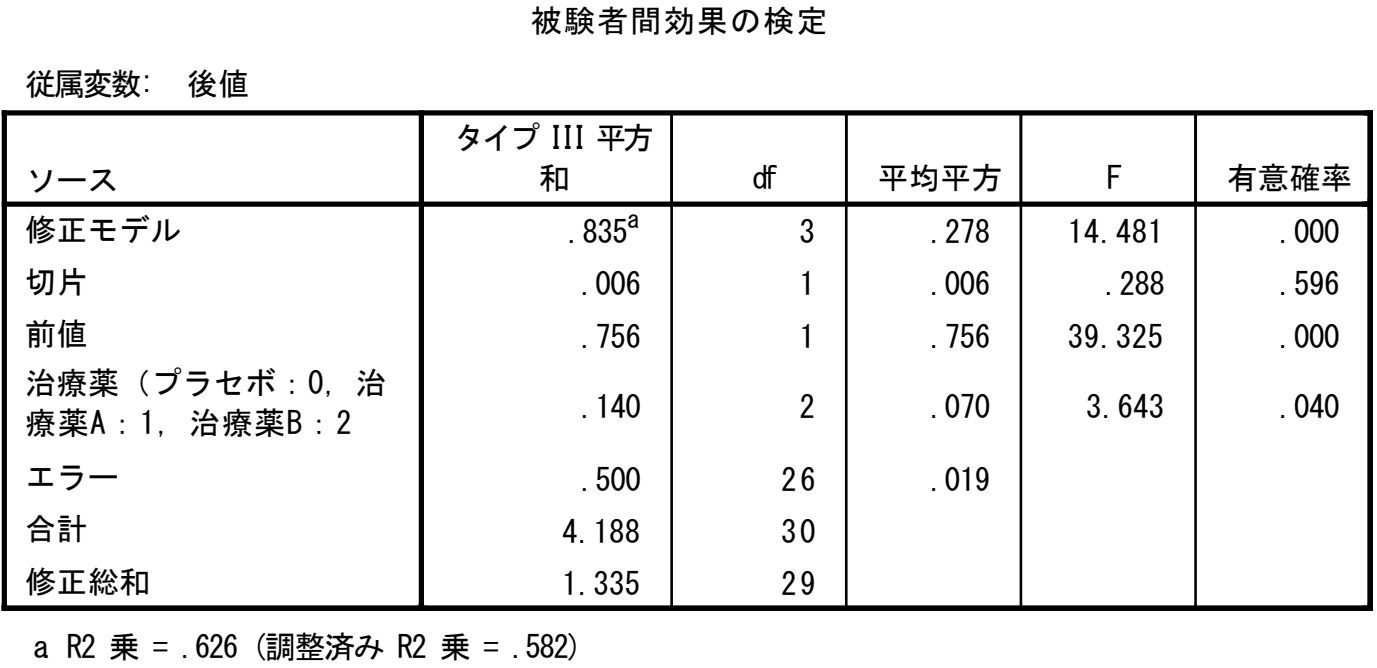
Test for difference in intercepts: StatFinale 0.04031; SPSS, 0.040; EZR, 0.04031.
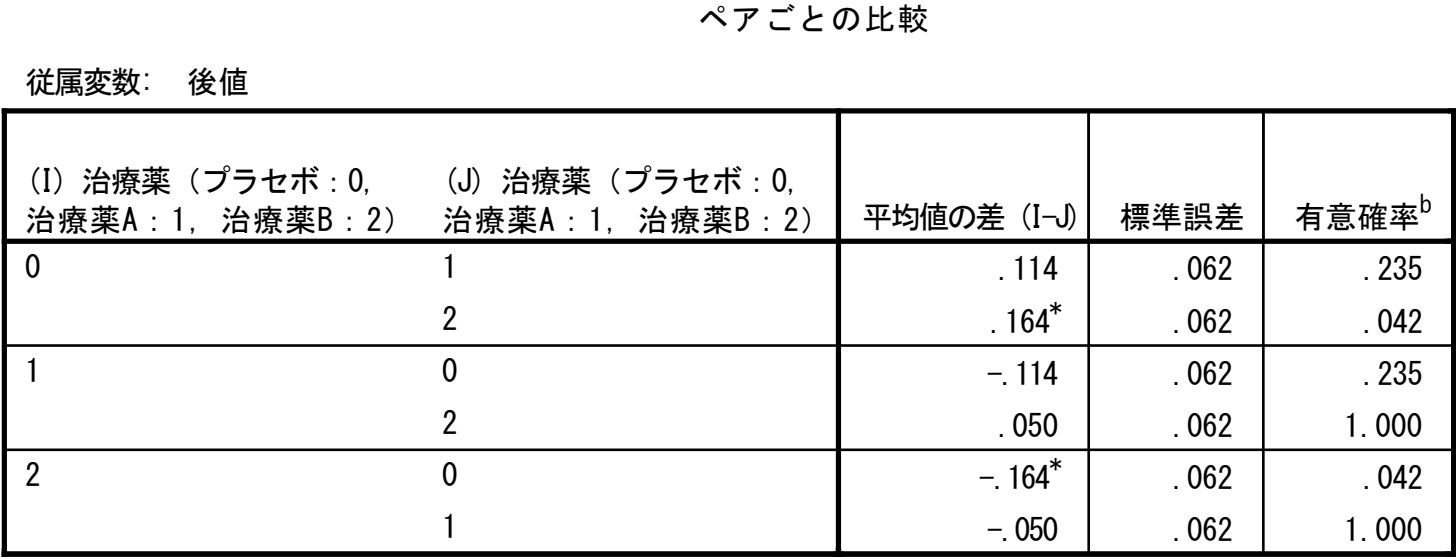
Multiple comparisons and confidence intervals (CIs): Exact match
Multiple C & CIs (Bonferroni & Tukey HSD): StatFinale
Multiple C & CIs (Bonferroni): SPSS
Multiple C & CIs (Zaiontz): StatFinale
Reports of SPSS & EZR

※Click pics to enlarge.