Exercise:
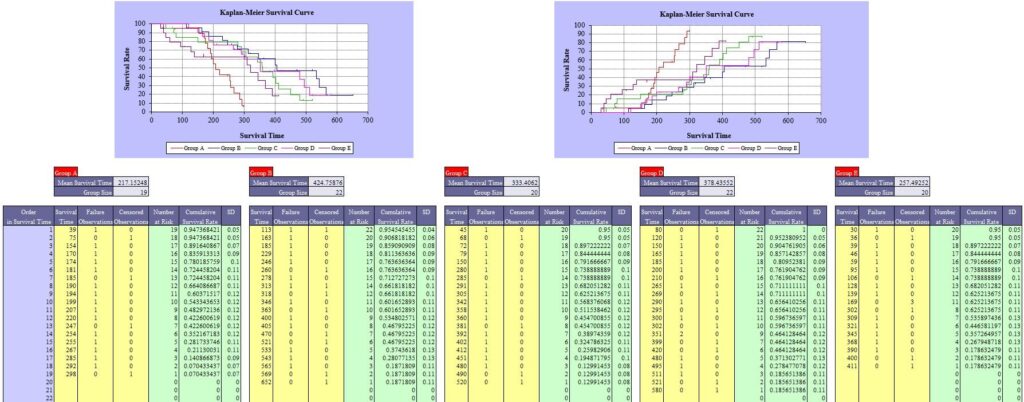
The following data chart shows the number of patient deaths and the survival period (day) until withdrawal of therapy of 5 groups (A: 19, B: 22, C: 20, D: 22, E: 20 cases, respectively).
Plot the Kaplan-Meier survival curve.


 N9
N9Exercise:
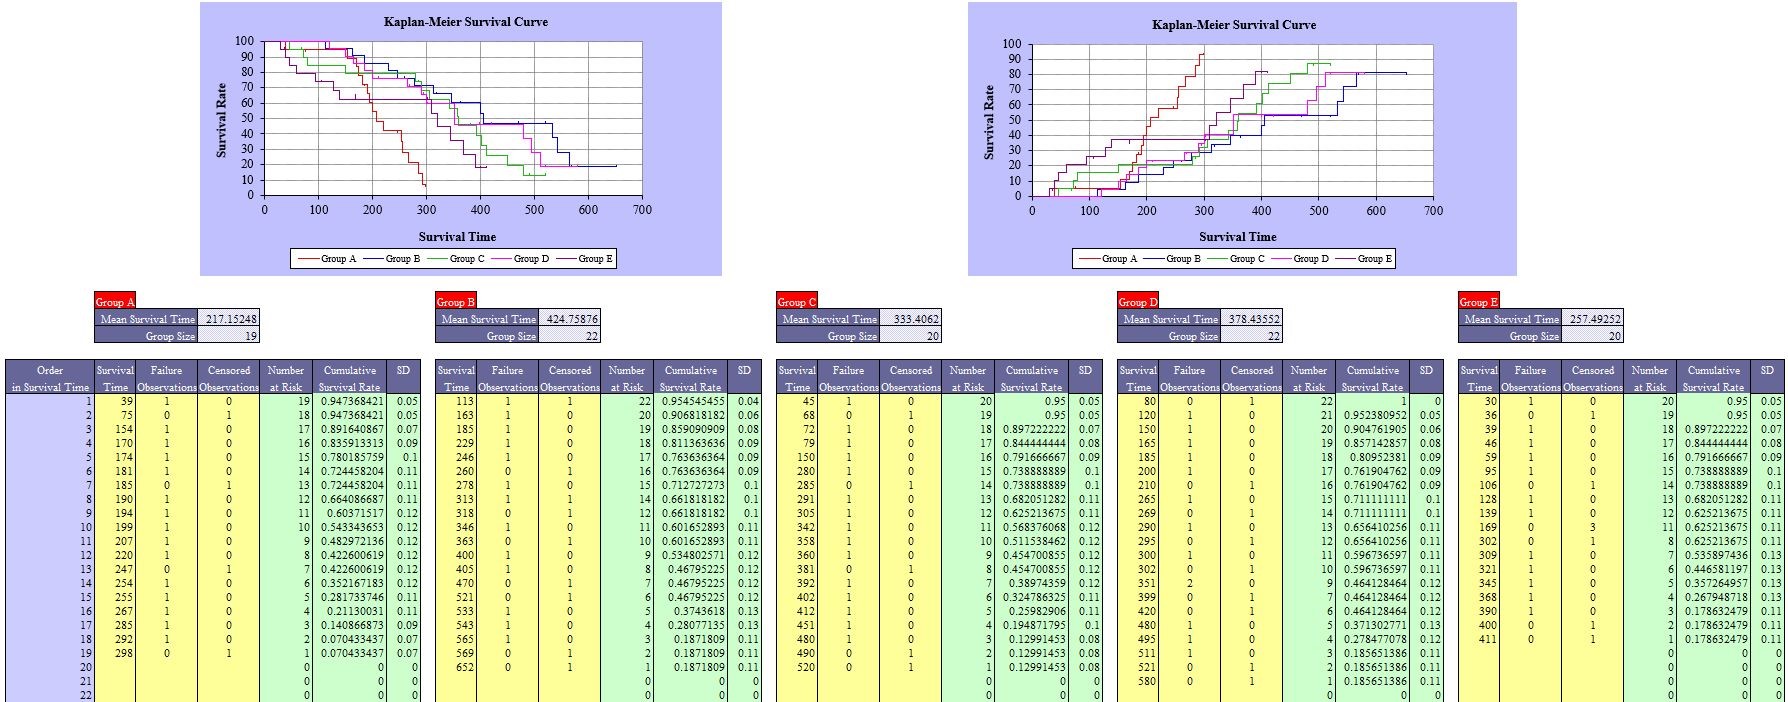
The following data chart shows the number of patient deaths and the survival period (day) until withdrawal of therapy of 5 groups (A: 19, B: 22, C: 20, D: 22, E: 20 cases, respectively).
Plot the Kaplan-Meier survival curve.

