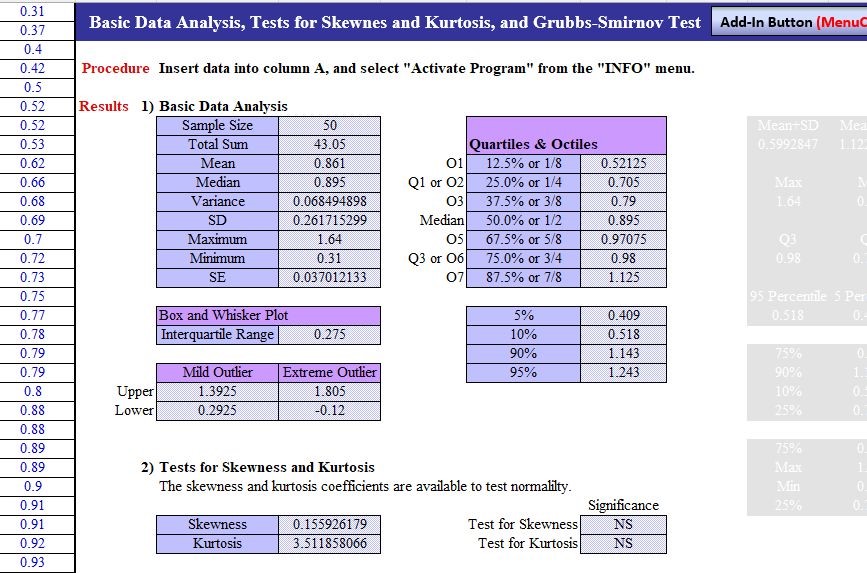
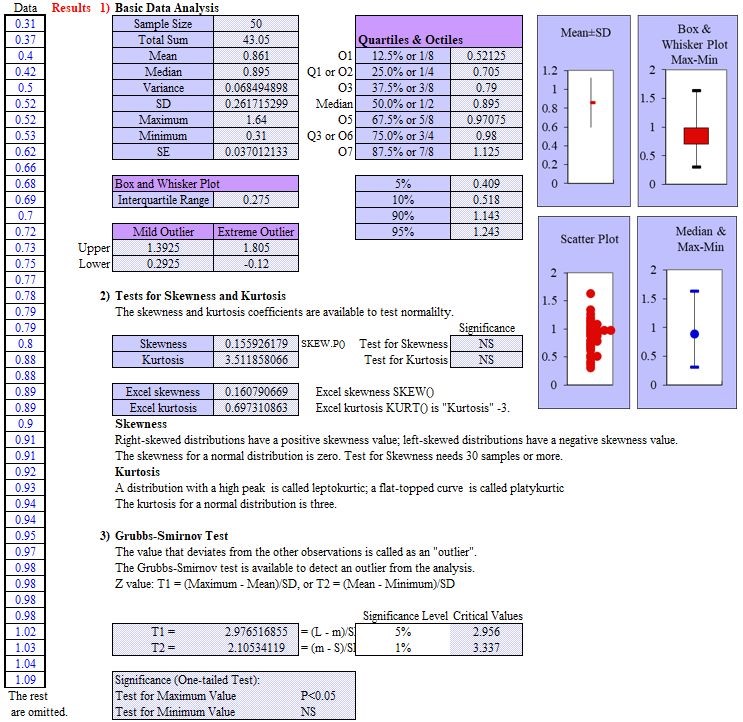
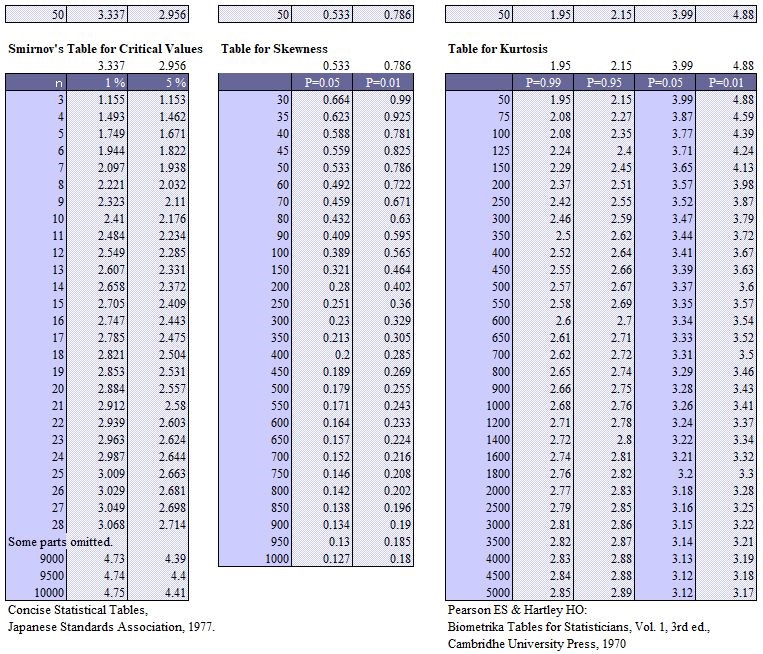
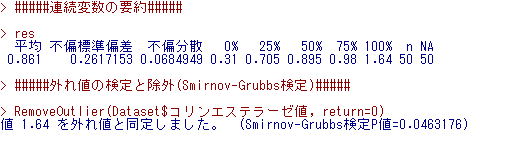
Descriptive Statistics & Grubbs-Smirnov Test for Outlier
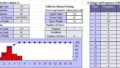
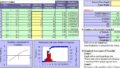
Graphs: Mean (SD), Box & Whisker Plots
Exercise:
We measured the data of cholinesterase in 50 persons in a group.
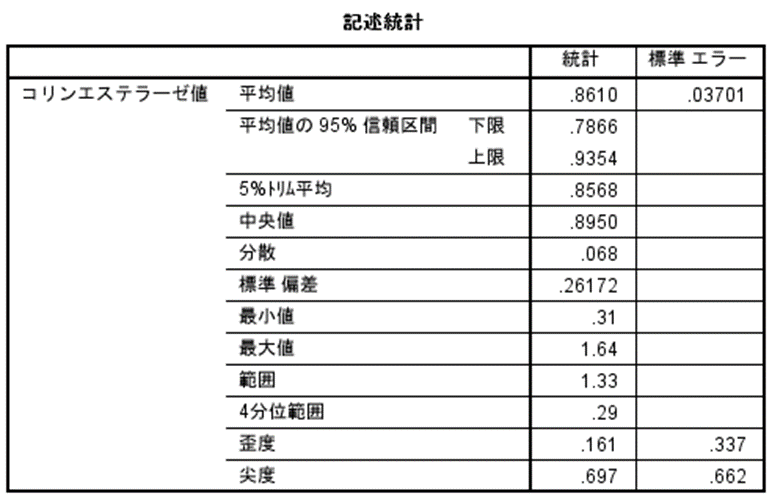
1) Please display basic statistical data (mean, SD etc.).
2) Check as to any outlier from the analysis, using the Grubbs-Smirnov test.
Comparative Verification Test
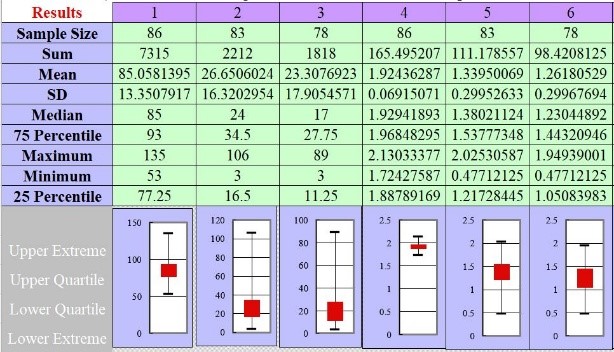
Except for SPSS skewness and kurtosis, the results are consistent with SPSS and EZR.
1) StatFinale’s skewness and kurtosis tests are performed by calculating the skewness and kurtosis of the entire population from sample data.
In Excel, skewness can be easily calculated using the formula SKEW(), but this is the skewness of the sample itself. Excel has a function called SKEW.P(), which calculates the skewness of the entire population.
In Excel, kurtosis can also be easily calculated using the formula KURT(), but this calculates excess kurtosis. The kurtosis of a normal distribution is 3, so Excel kurtosis is “kurtosis – 3”.
SPSS’s skewness and kurtosis are the same values as the Excel formulas SKEW() and KURT().
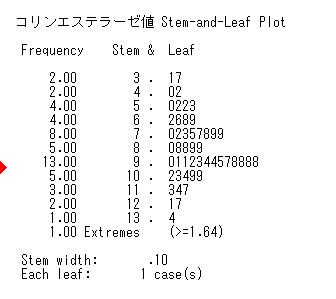
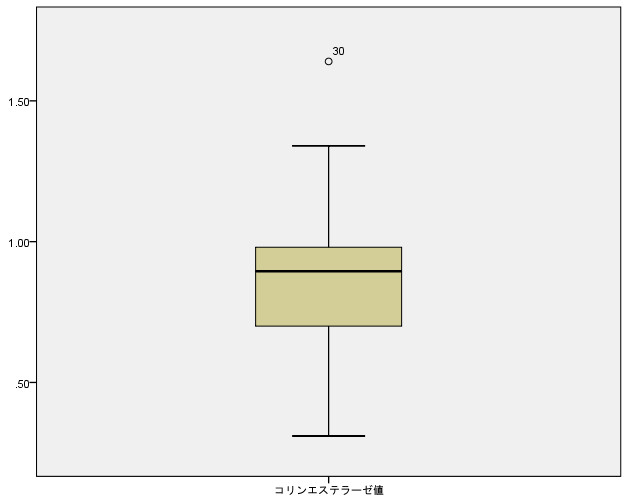
2) StatFinale’s Grubbs-Smirnov test indicated abnormality of the maximum value (P<0.05), SPSS also identified it as an Extremes value (>=1.64), and EZR also identified the maximum value (1.64) as an outlier.
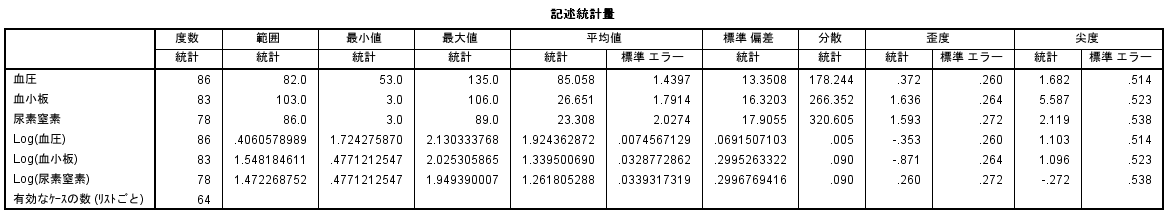
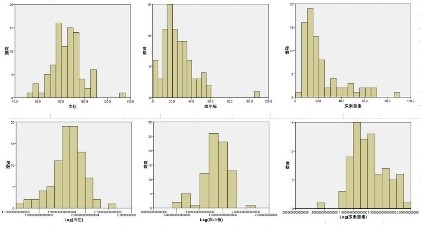
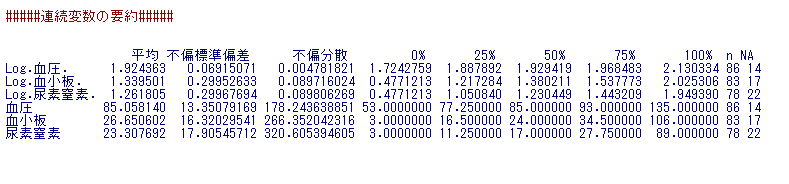
Reports of SPSS & EZR
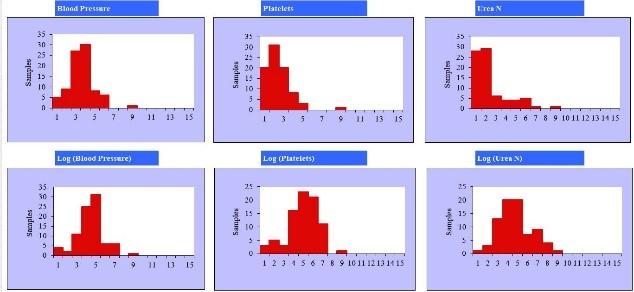
1)Sample: One group only
※Click pics to enlarge.
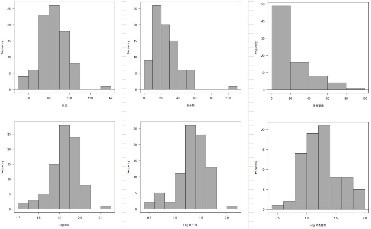
2)Sample: Multiple groups
In StatFinale, the aggregated results for multiple groups are in the worksheet “MULTI” in “INFO”, and figures are displayed using “HISTM”.
※Click pics to enlarge.