Exercise 1:
Data were referred from the article by Hanley JA and McNeil BJ (Radiology, 148: 839-843, 1983), who proposed the ROC at the first time.
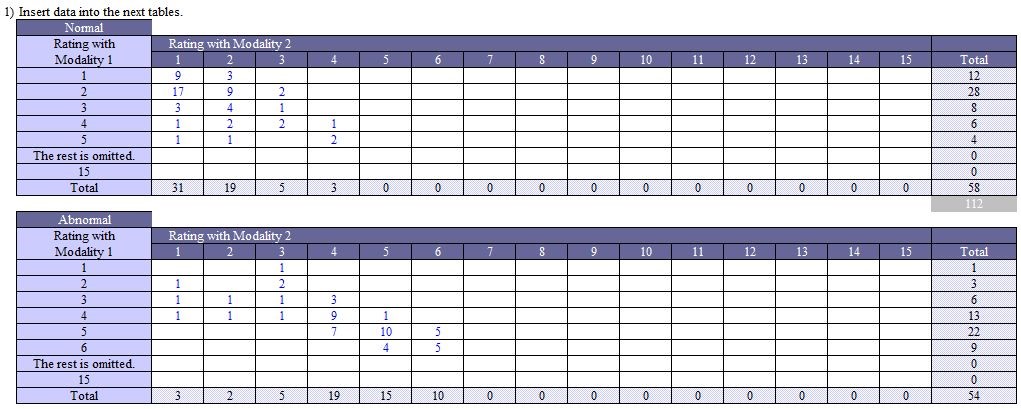
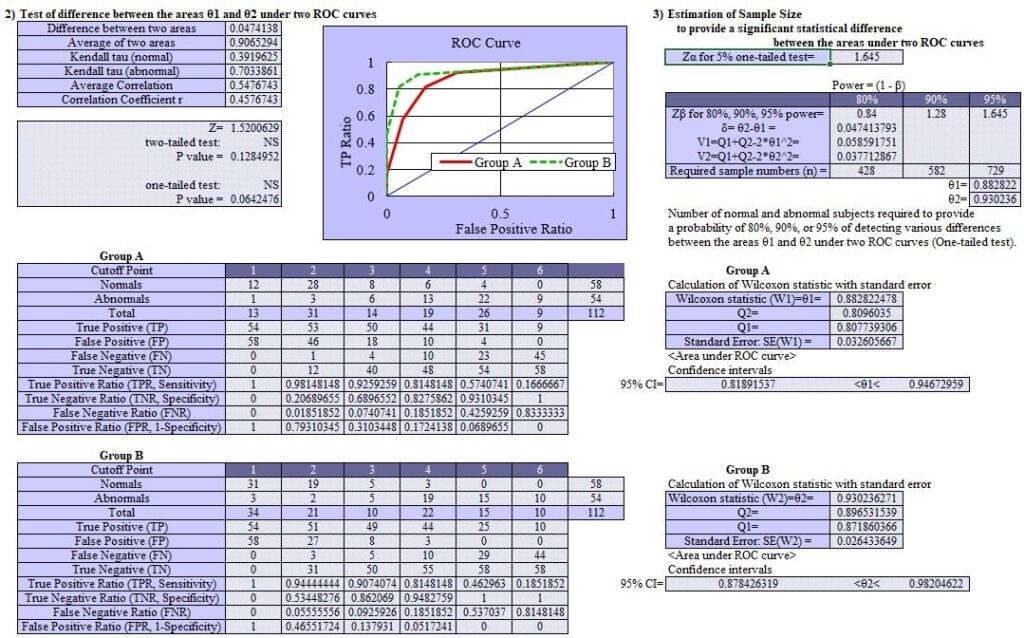
Two CT image reconstruction methods (Modality 1 and Modality 2) were compared for the ability in making differential diagnosis of normal and abnormal findings. Fifty-eight normal images and 54 abnormal images were prepared and assessed the images with 1 to 6 evaluation scores. Scores indicate 1 = ‘normal’, 2 = ‘probably normal’, 3 = ‘may be normal’, 4 = ‘may be abnormal’, 5 = ‘probably abnormal’, 6 = ‘abnormal’.
The following data chart was made. Perform the ROC analysis to evaluate which reconstruction method has superiority.
Exercise 3:
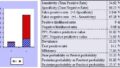
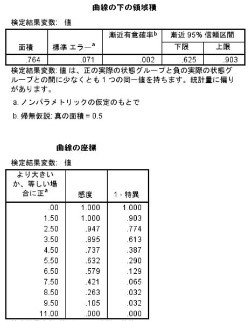
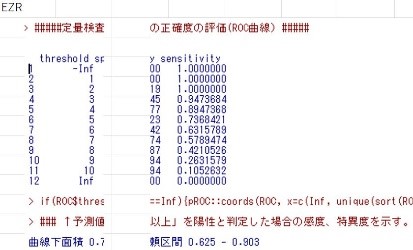
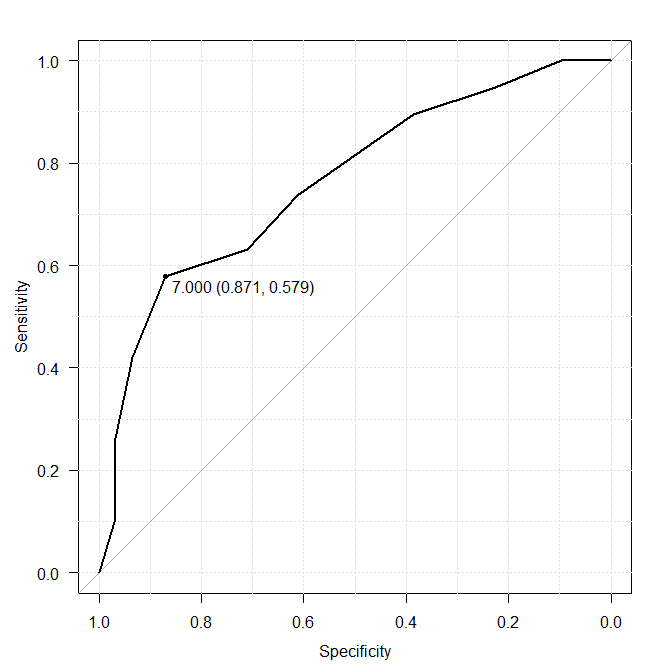
The following summary is derived from sample 3 data. Perform one ROC analysis which includes calculation of the AUC, the test of the AUC against the value 0.5, and finding the optimal cutoff point with the Youden index.

Comparative verification test
Exercise 1
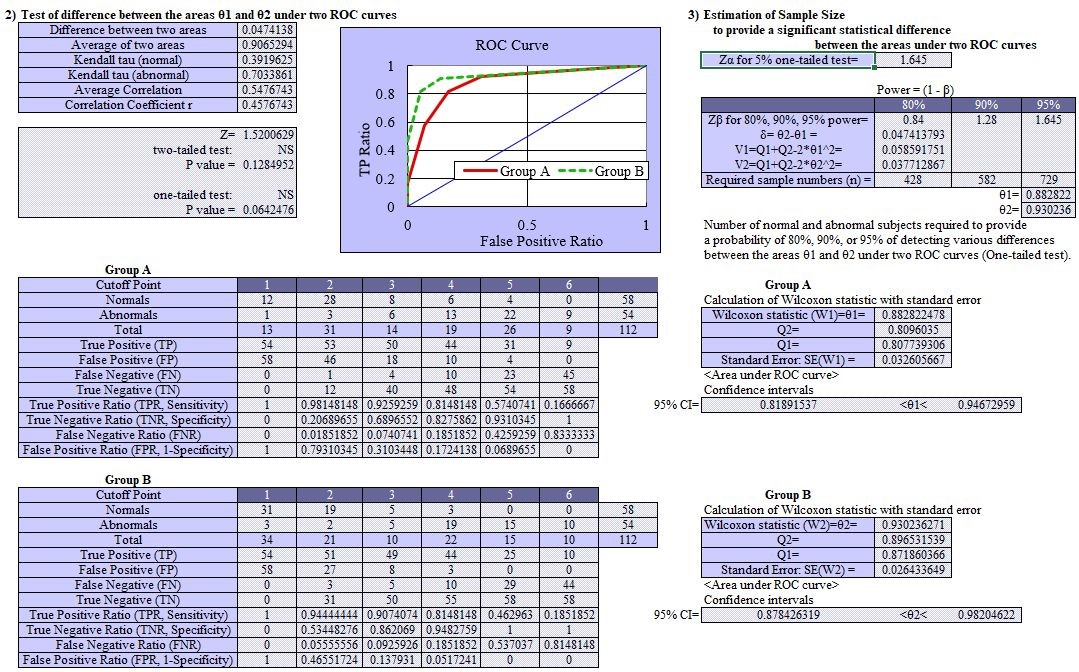
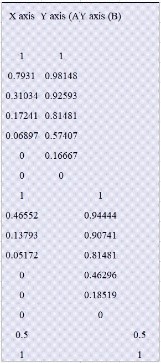
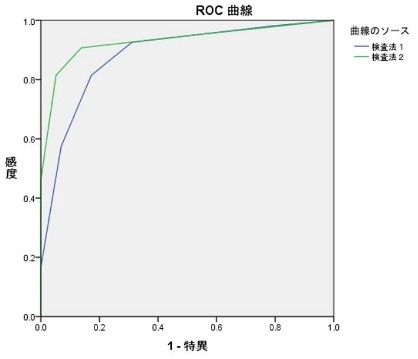
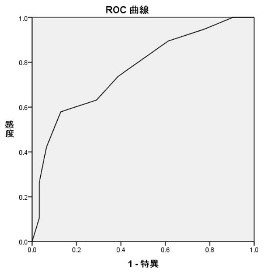
Two group ROC curves: ROC curves are consistent with SPSS and EZR. EZR shows 2 groups separately. X-axis and Y-axis data in StatFinale are also shown below.
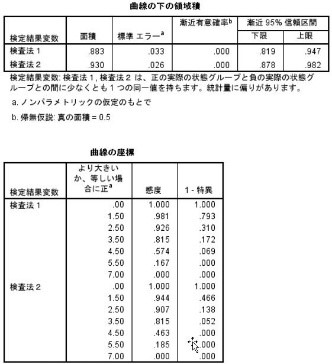
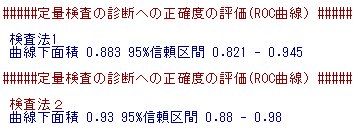
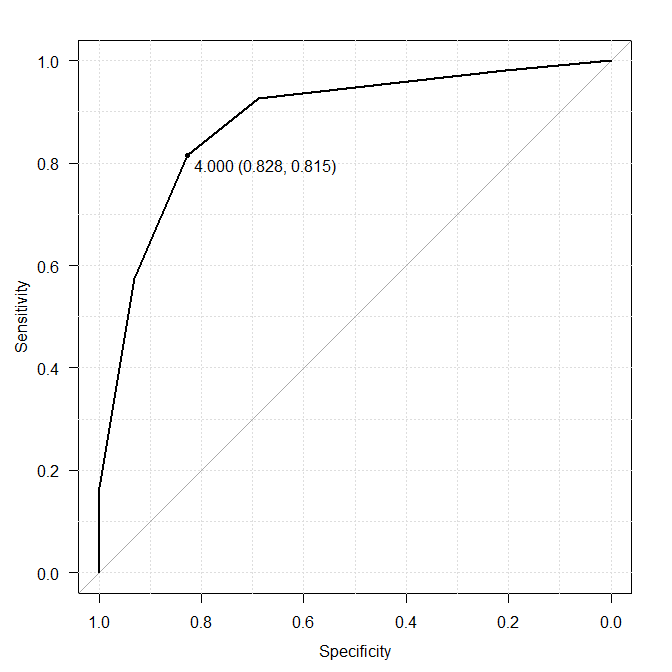
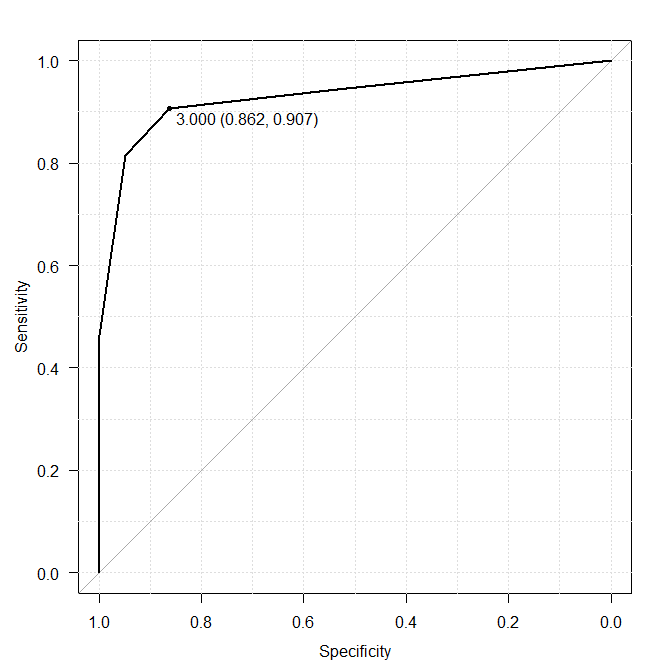
Wilcoxon statistics: Areas under the curve (AUC) for modalities 1 and 2 are 0.883 and 0.930. Exact match with SPSS and EZR.
95% confidence interval for AUCs: consistent with SPSS, slightly different from EZR.
Test of difference between the areas under two ROC curves: StatFinale P value is 0.128, SPSS and EZR are not done.
Exercise 3
Youden Index for the Optimal Cutoff Value: Statfinale is 0.4499, SPSS and EZR are not done.
Note) As of 2025, SPSS is Ver. 31, and it seems that the Youden Index has been incorporated since Ver. 30. Ver. 28 and later require half price for updates, and full price for Ver. 27 and earlier.
Reports of SPSS & EZR
Exercise 1
※Click pics to enlarge.
Exercise 3
※Click pics to enlarge.