Exercise1:
The following data show the required operation time (minutes) of 2 surgeons for the same surgical procedure. Analyze whether there is a statistical difference in operation time between 2 surgeons.
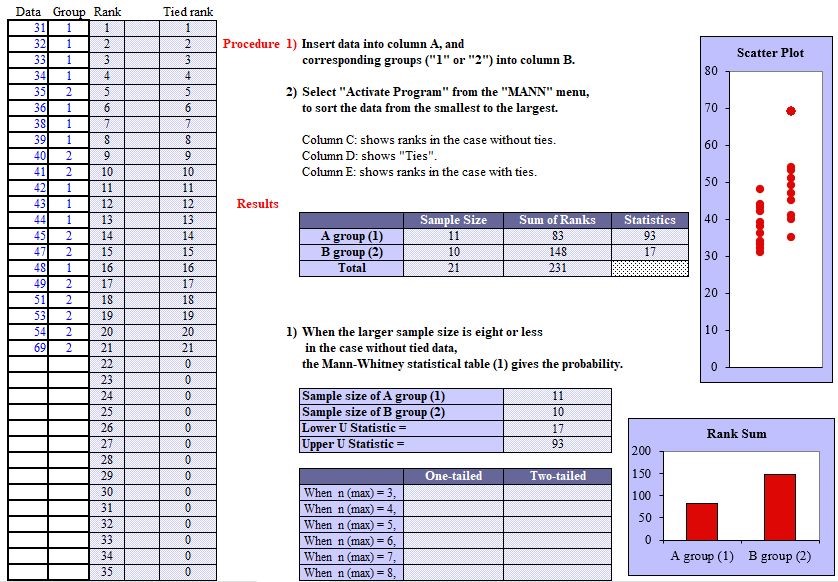
Doctor A(11 Cases):39, 33, 48, 34, 43, 38, 32, 42, 36, 44, 31
Doctor B(10 Cases):51, 40, 54, 45, 35, 49, 47, 53, 41, 69

Exercise2:
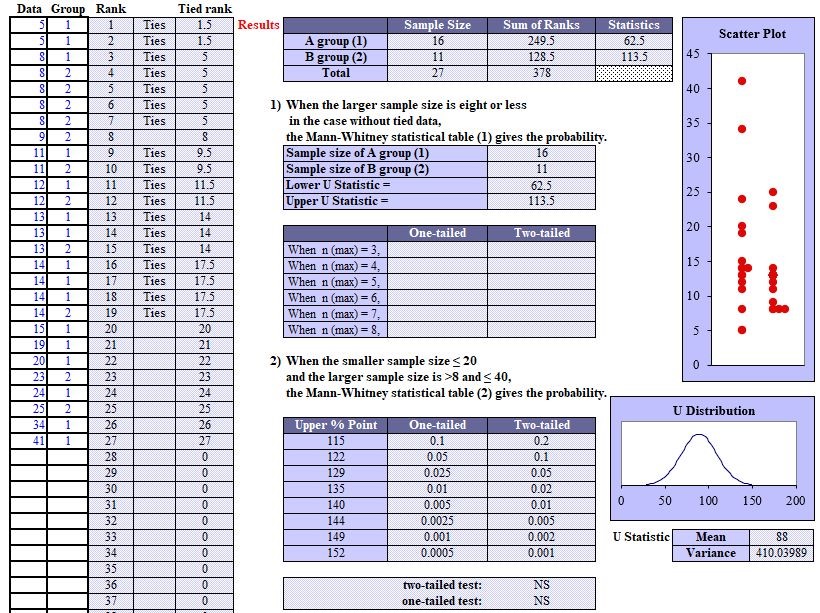
Data show the effect of 2 therapeutic drugs on survival time (weeks) in a disease animal model. Analyze whether there is a statistical difference in survival time between 2 drugs.
Drug A:34, 5, 11, 5, 20, 24, 8, 14, 14, 13, 14, 41, 13, 15, 19, 12
Drug B:8, 14, 8, 8, 8, 11, 25, 23, 9, 12, 13
Comparative Verification Test
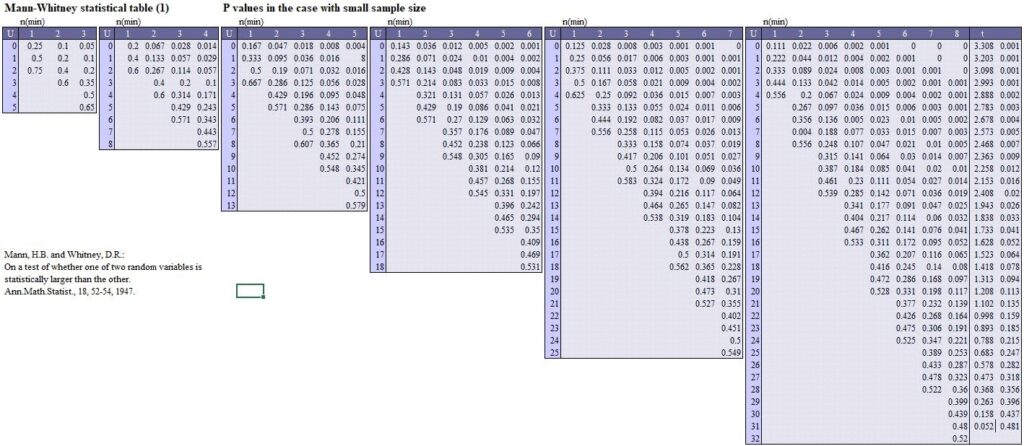
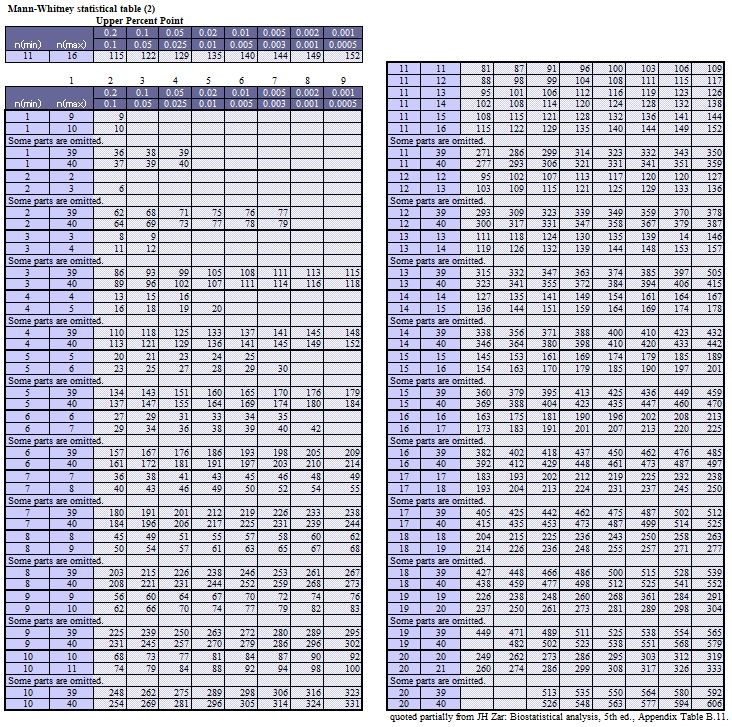
Mann-Whitney U test:
Sample 1: StaFinale, <0.01; SPSS, 0.006; EZR, 0.00619.
Sample 2: StaFinale, NS (>0.2); SPSS, 0.212; EZR, 0.0215.
Sample 3: StaFinale, 0.056; SPSS, 0.057; EZR, 0.0571.
Sample 4: StaFinale, untestable data (P value derived from Z score is 0.0358); SPSS, 0.036; EZR, 0.0358.
Samples 1 and 2 have a small number of cases with the same ranking. Statfinale uses U-test Table 2 which does not provide precise P values.
Sample 3 has a small number of cases without ties. Statfinale uses U-test Table 1 which provides precise P values.
Reports of SPSS & EZR
The SPSS report format is the same for 1, 2, 3, and 4.
Samples 1, 2, and 3 were calculated using a formula without using U-test tables. Sample 4 had a small number of cases (5 and 3 cases) and a tie. StatFinale did not allow testing, but SPSS and EZR showed it to be significant (miscalculation? Same as the P value derived from the Z value!).


※Click pics to enlarge.