Exercise:
The following data show the operation time of 3 hospitals for the same surgical procedure.
1) Analyze whether there are statistically significant differences among hospitals.
2) If there are significant differences among hospitals, find which hospitals have statistical differences in the operation time.
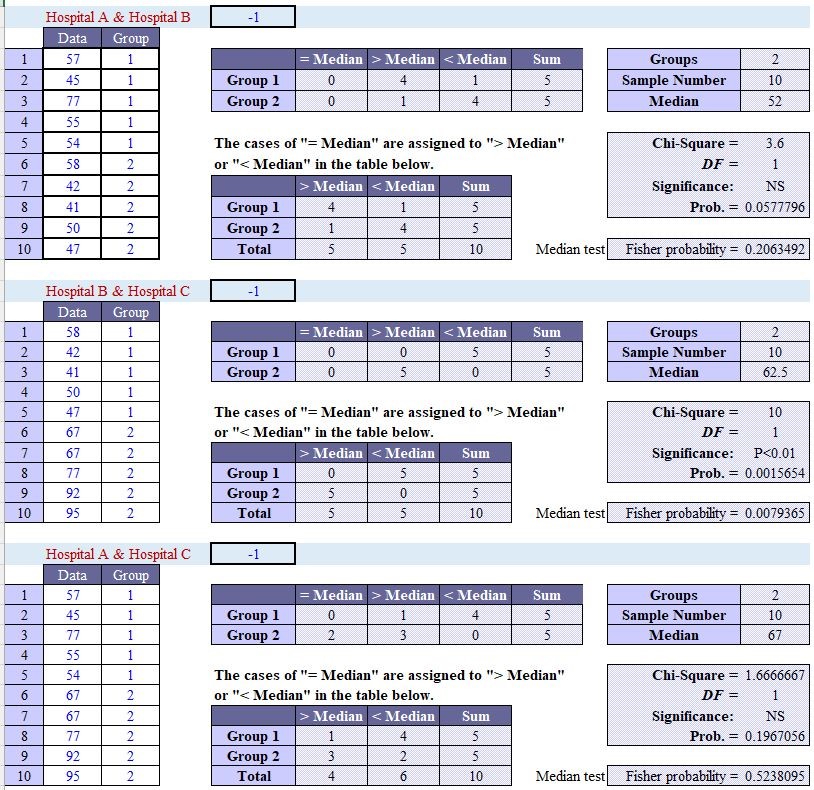
Hospital A: 57, 45, 77, 55, 54 Hospital B: 58, 42, 41, 50, 47 Hospital C: 67, 67, 77, 92, 95 minutes
Comparative Verification Test
MEDIAN test (χ2 test)
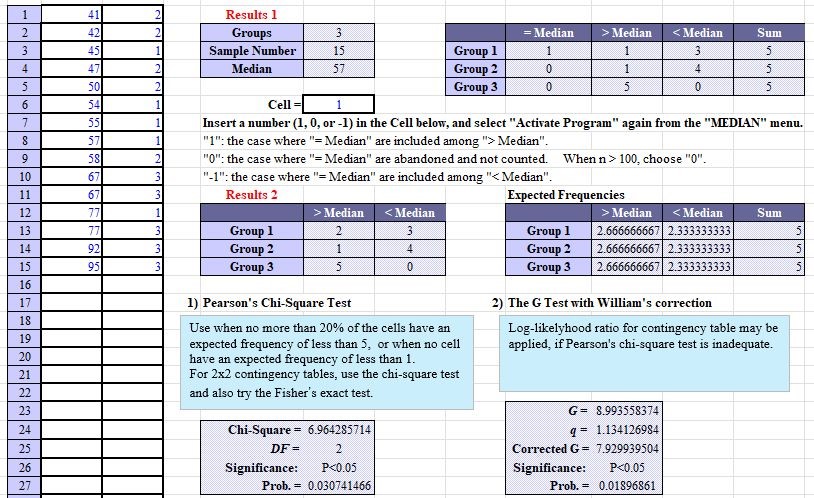
When dividing data into two groups by the median, the P value will change depending on which group the median is included in. SPSS displays the P value when “values equal to the median are included below the median” as the significance probability.
See multi-samples MEDIAN test.
The above data is a comparison of three groups of sample data between two groups. After conducting a MEDIAN test between two groups, the Pearson χ2 test and Fisher significance probability were calculated using the CHI test for two independent groups.
EZR does not have a corresponding program.
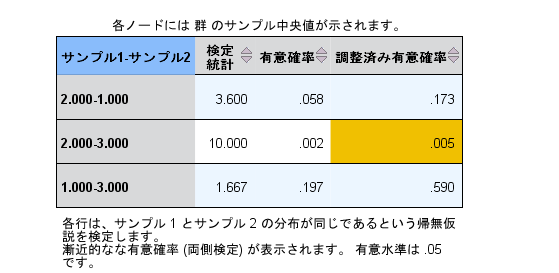
Reports of SPSS
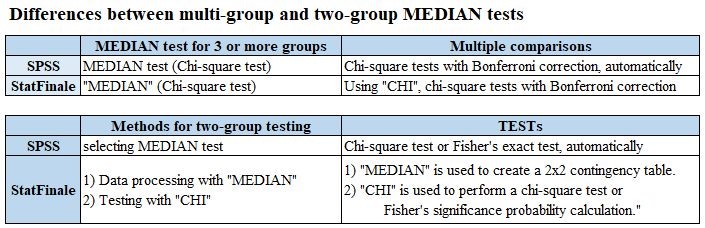
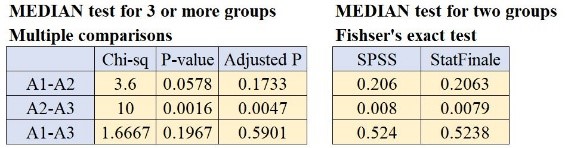
When performing a MEDIAN test for three groups, SPSS automatically performs a χ2 test between two groups and calculates an adjusted P value (χ2 test P value x number of combinations) using Bonferroni correction. In this case, the number of combinations is 3.
In addition, if users perform a MEDIAN test between two groups individually, the Fisher significance probability (one-sided probability multiplied by two) will be calculated.
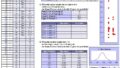
The results calculated with StatFinale are shown below.

※Click pics to enlarge.