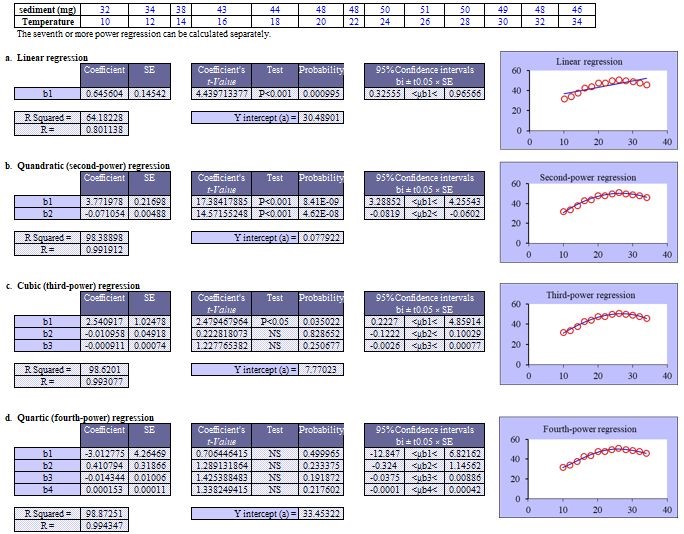
The sediment amounts of post-chemical reactions were different in each reaction temperature as shown in the table. Analyze the relation between temperature (℃) and sediment amounts (mg) using a polynomial regression.
Comparative Verification Test
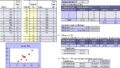
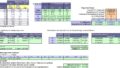
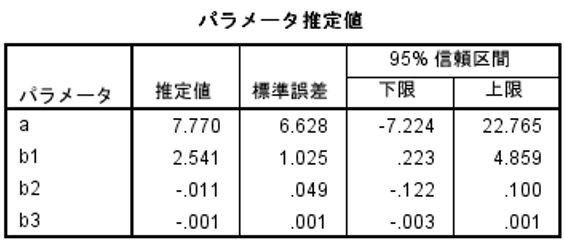
Polynomial regression (nonlinear regression): StatFinale & SPSS, partial regression coefficient estimates, standard errors, 95% confidence intervals, exact agreement.
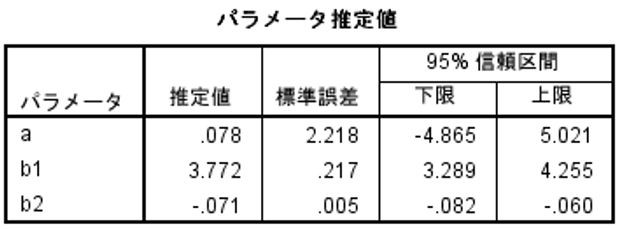
Note: SPSS displays all coefficients below 0.001 as 0.001.
Significance test (StatFinale): Partial regression coefficients b1 and b2 of the quadratic equation are both P<0.001. Cubic equation b1 is P<0.05, b2 and b3 are “NS (not significant)”. Therefore, the quadratic equation was considered appropriate. SPSS did not calculate the P values for estimated regression coefficients in nonlinear regression models.
Quadratic R-squared (contribution rate): StatFinale, 0.984; SPSS 0.984.
Cubic R-squared (contribution rate): StatFinale, 0.986; SPSS 0.986.
(EZR has no corresponding program.)
Reports of SPSS
Nonlinear regression analysis in SPSS requires calculation once with a quadratic formula and again with a cubic formula. For some reason, SPSS does not produce the P value of the partial regression coefficient, so it is not possible to determine at what degree of the formula to stop. Therefore, users seem to use the free software R to perform the calculations.
!https://www.ibm.com/support/pages/can-i-get-p-values-or-significances-estimated-regression-coefficients-nonlinear-regression-models-spss
※Click pics to enlarge.