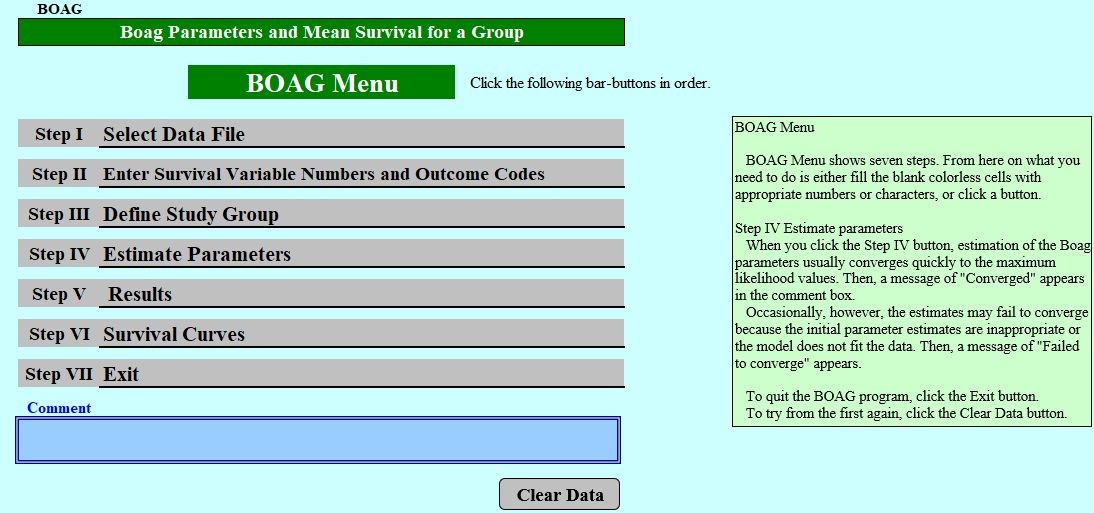
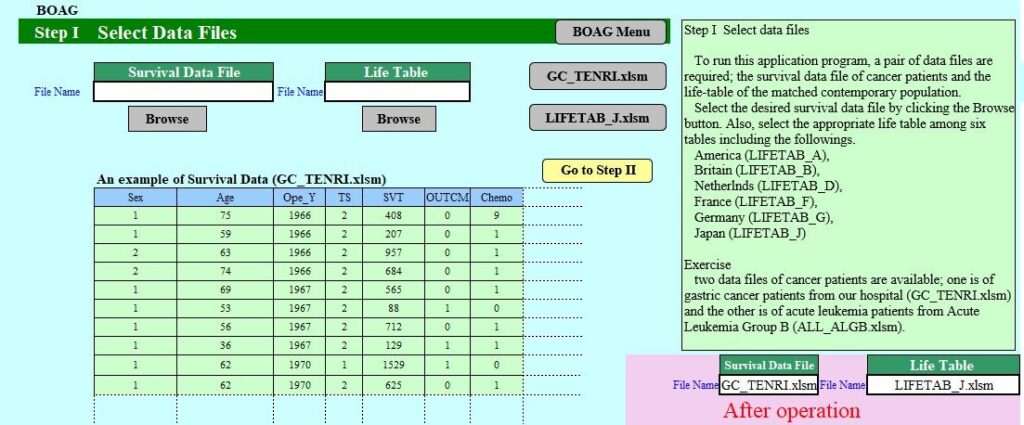
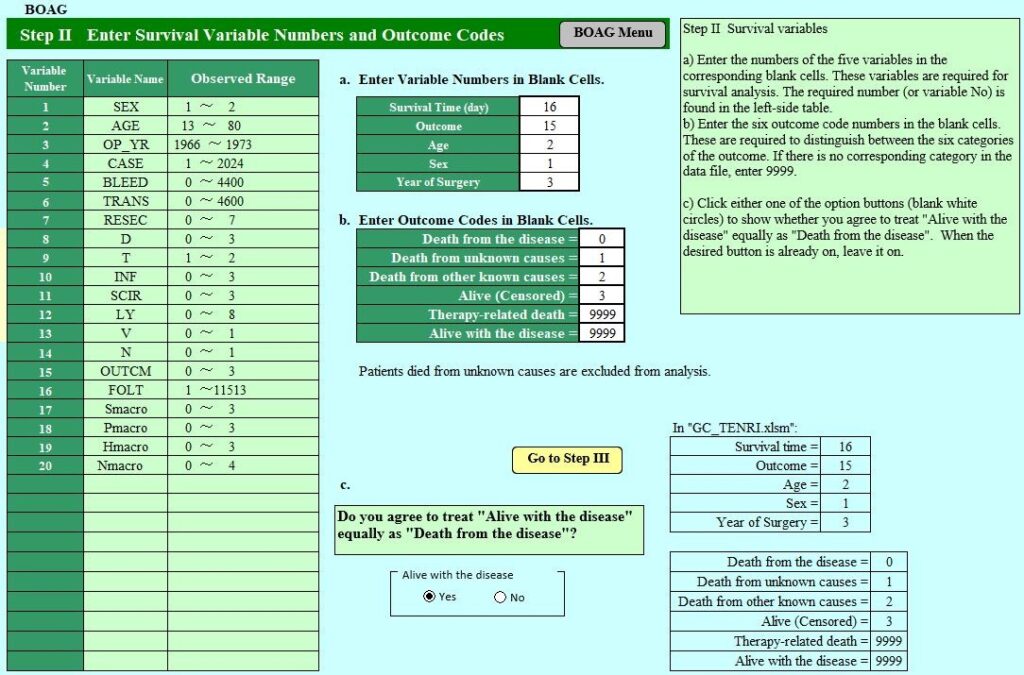
GC_TENRI.xlsm


Step V Results
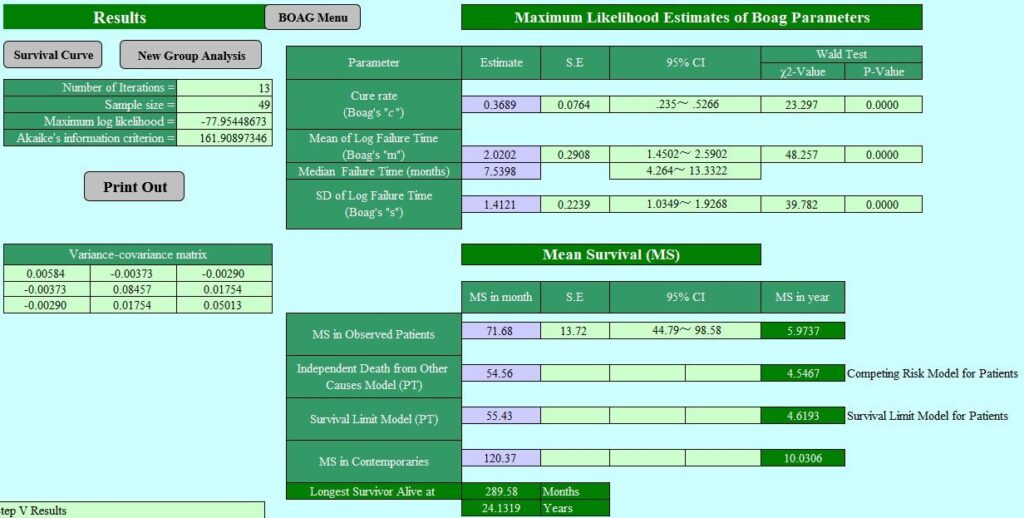
The maximum likelihood estimates of the Boag parameters and mean survivals (MS) of the patient group are displayed as well as the MS of the contemporary population.
Thereafter, you have three options,
1) return to BOAG Menu (and exit),
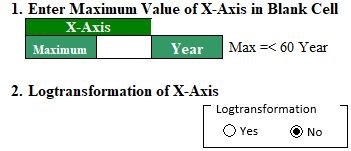
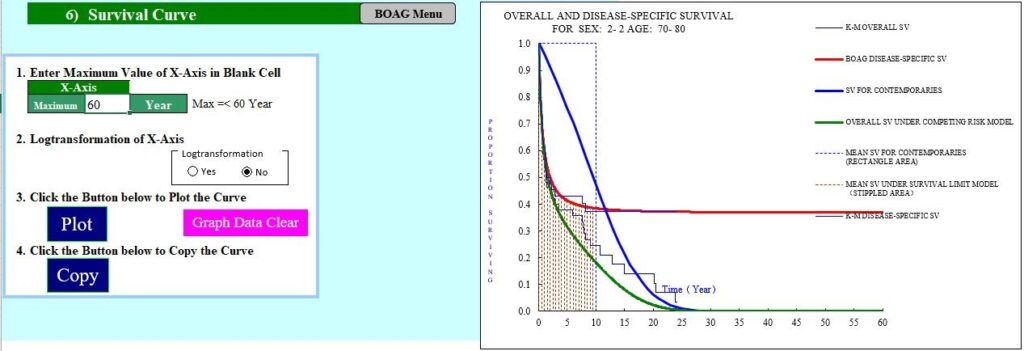
2) view the survival curves of the defined group (Survival Curve), or
3) analyze a new group (New Group Analysis).
Click either one of these command buttons.
Further, click the Print Out button which takes you to the Print dialog box.

Please read the following PDF, “BOAG”.

