Exercise:
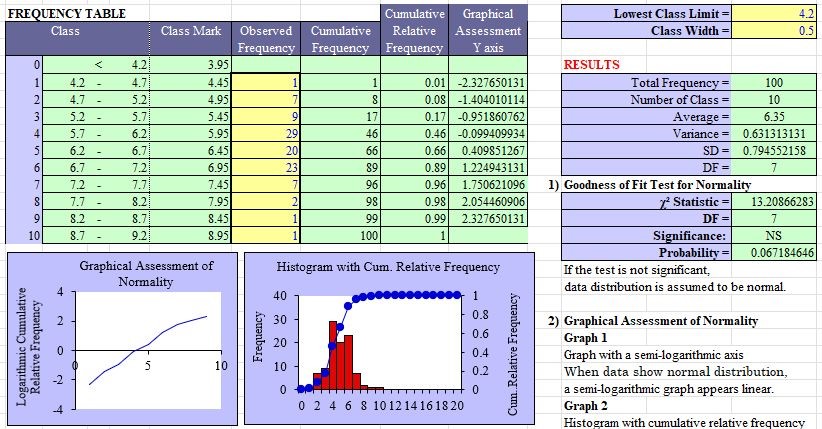
When we measured total serum protein (g/dL) levels of 100 subjects of a certain age, the lowest value was 4.2, each class range was 0.5, and the frequency of distribution was as followed.
1) Illustrate the probability curve, histogram, and cumulative relative frequency using lognormal probability papers.
2) Calculate the goodness of fit for normality.


